
Bb Learn Course Reports -- Course Analytics, or Analytics for Learn, or A4L
Introduction
Drexel ITG, the central technology office for Blackboard Learn at Drexel, has developed and made available a tool to capture analytics in relation to Bb Learn courses called Analytics for Learn (A4L). They have put a number of resources out in regards to this tool, which I will list below along with some hopefully helpful descriptions of the reports this tool provides. If you have any questions about using A4L, please let me know.
Instructor A4L reports are available in the "Control Panel" in a course under "Evaluation" and then "Course Analytics." Instructors can add the A4L report for students to their courses by first activating the tool under the "Control Panel" under "Customization" and "Tool Availability" and enabling "Course Analytics (Student Report)," then providing a link to the report in the left-hand course menu by adding a "Tool Link" (hit the plus sign at the top of the course menu) and selecting "Course Analytics (Student Report)" as well as by providing a name and checking the box to make the link available. If you have any questions about doing this, let me know.
The "Report Help" link at the top of each generated A4L report provides additional definitions and help with understanding the A4L report.
*A4L does NOT require you to turn on statistics tracking on content in content areas in order to provide statistics.*
A4L -- Course-at-a-Glance - Especially for Gateway Initiative or Early Warning Courses
Course-at-a-Glance is used with Drexel CCI Gateway Initiative or Early Warning courses, but it's ALSO a great report for any courses.
Here's how to access Course-at-a-Glance.
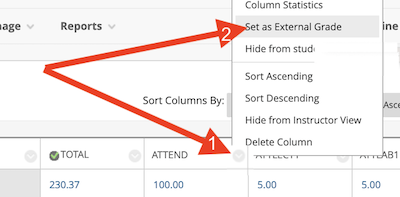
- Set your External Grade column (see NEXT section BELOW for how).
And make sure this column is set to calculate all grades overall.
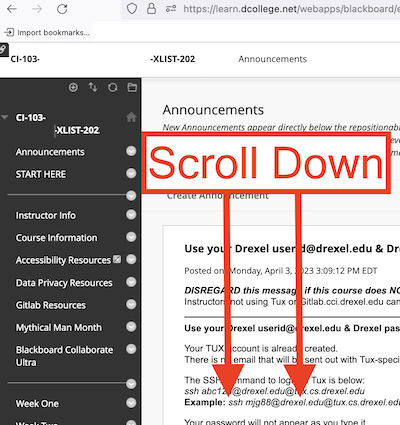
Email Mike Galloway, Assistant Director of Platform and Technology Support at Drexel CCI at mjg88@drexel.edu if you need any help setting up a column to calculate the overall grade for the course. - When you are in your Bb Learn course section, scroll down.
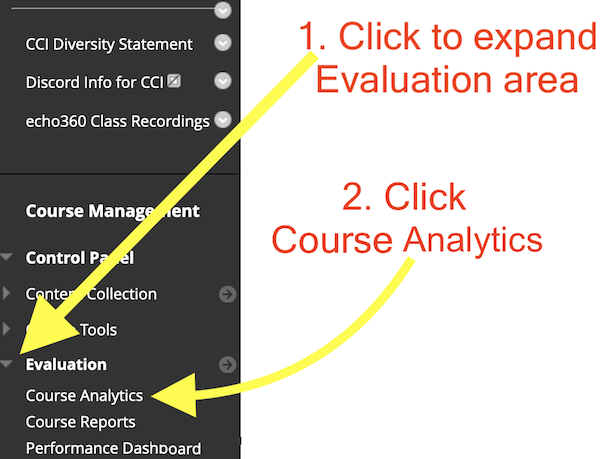
- Click to expand the Evaluation area, then click Course Analytics.
- Click the circled down arrow next to the Course Analytics report.
Then click Run.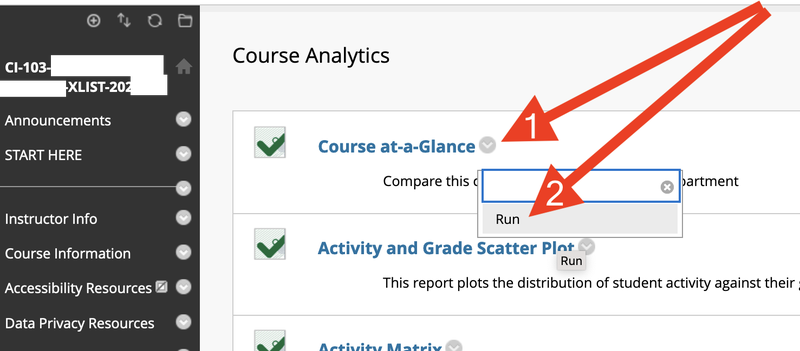
- Wait a few moment. The report for all students will appear.
Now scroll down.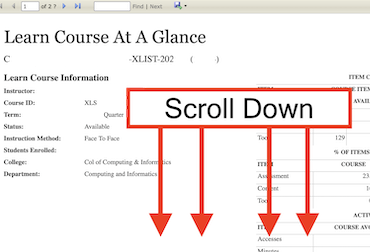
- Click a student's name.
This lets you drill down to see information on just that student.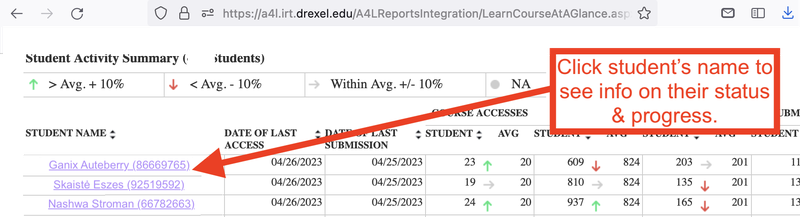
- You can now see information on just that student.
More information on the tables and chart is provided beneath these instructions.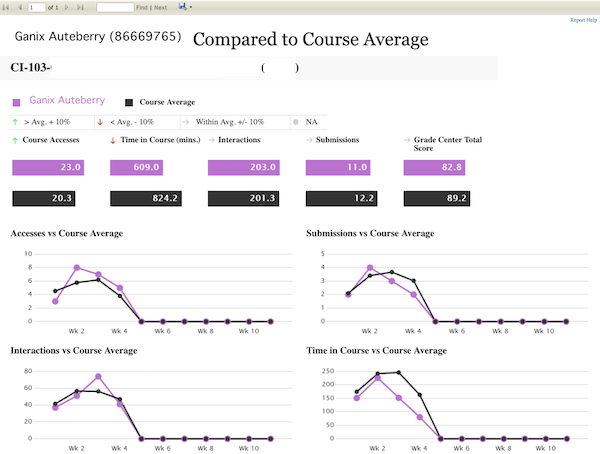
- You can save these reports to your computer in a number of different formats.
See top left of the page.
Report navigation options are there as well.
More information on the tables and chart is provided beneath these instructions.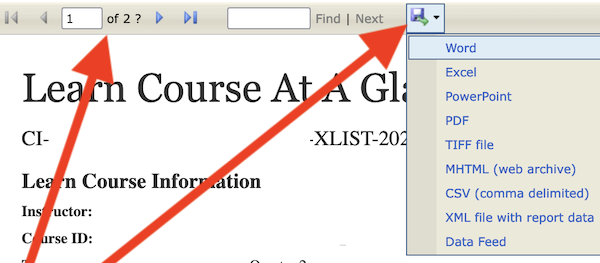
This Course at a Glance report show a number of things. Here is some more information on terms used:
- average course accesses (logins) for your course in comparison with similar courses, or courses in the same department (usually courses with the same subject code) with the same delivery method (face-to-face, online, etc.)
- average minutes that students were in your course in comparison with similar courses
- (3) average number of interactions (number of clicks) that students had with your course in comparison with similar courses
- (4) average number of submissions (assignments, tests, surveys, discussion posts, journals, blogs, wikis, etc.) made to your course in comparison with similar courses
- a count of Bb Learn content (items, folders, etc.), assessments (assignments, tests, etc.), and tools (discussion boards, blogs, etc.) in your course in comparison with the average for similar courses
- for items 1-4 above, this report provides a breakdown for each student compared with your course's averages and includes with it date of last access, date of last submission, a course access trend graph, and "Grade Center Score" compared with your course's averages.
- Interaction stats may track both number of clicks on a link as well as the number of times the webpage that contains the link was loaded into an internet browser, such as Chrome or Firefox or Safari or Edge or Internet Explorer. This was discovered by Drexel ITG on 10/18/16. Checked with ITG again on 3/28/17.
Making Analytics for Learn Visible to Students
You should make the "Course Analytics Student Report" available to students,
so that the students can view their own data.
Here's how.
First, turn on the "Course Analytics Student Report" tool.
- Click "Customization" under the "Control Panel" in the left-hand course menu in your Bb Learn course shell.
- Click "Tool Availability."
- Check “Course Analytics (Student Report)."
Now, make the link to the report available.
To do so, see the "Creating a Tool or Web or Course Link" section at the following webpage, and make a Tool Link for "Course Analytics (Student Report)."
External Grade Column
These reports rely to varying degrees for their data on what "Full Grade Center" column is designated as the "External Grade Column."
So it's real important for ANY of these reports that the Total or
Weighted Total or BannerGrade or FinalGrade or whatever the name of the
column in Full Grade Center that you are using to track student's
overall grade at the mid-point or end of the course (and throughout the
course, of course -- yuck, yuck, yuck) has a GREEN CHECK MARK in the top
row, marking it as the EXTERNAL GRADE column. 
A4L -- Student At A Glance
Another Course Analytics option... we will try to add more information about this option soon, but Course-At-A-Glance is recommended for Gateway and/or Early Warning courses.
This report can be created in your course and offered to students. It shows students their course accesses (logins) vs. the course average, their time in the course vs. the course average, their interactions (number of clicks that a student has in the course) vs. the course average, their submissions vs. the course average, and their "Grade Center Score" vs. the course average. Each of these areas is represented numerically and visually.
Interaction stats may track both number of clicks on a link as well as the number of times the webpage that contains the link was loaded into an internet browser, such as Chrome or Firefox or Safari or Edge or Internet Explorer. This was discovered by Drexel ITG on 10/18/16. Checked with ITG again on 3/28/17.
A4L -- Activity and Grade Scatter Plot
Another Course Analytics option... we will try to add more information about this option soon, but Course-At-A-Glance is recommended for Gateway and/or Early Warning courses.
This report shows course access (logins) vs. "Grade Center Score" on a scatter plot graph.
A4L -- Activity Matrix
Another Course Analytics option... we will try to add more information about this option soon, but Course-At-A-Glance is recommended for Gateway and/or Early Warning courses.
This report visually represents course interactions (number of clicks that a student has in the course) vs. "Grade Center Score."
Interaction stats may track both number of clicks on a link as well as the number of times the webpage that contains the link was loaded into an internet browser, such as Chrome or Firefox or Safari or Edge or Internet Explorer. This was discovered by Drexel ITG on 10/18/16. Checked with ITG again on 3/28/17.
A4L -- Course Submission Summary
Another Course Analytics option... we will try to add more information about this option soon, but Course-At-A-Glance is recommended for Gateway and/or Early Warning courses.
This report shows each student's number of submissions (assignments, tests, surveys, discussion posts, journals, blogs, wikis, etc.), their latest submission, enrollment status, last submission type, and graph showing the trend of their submissions.